









Warehouse Efficiency: KPIs, Benchmarks, and Fixes
Summary • 15 minutes read
Share


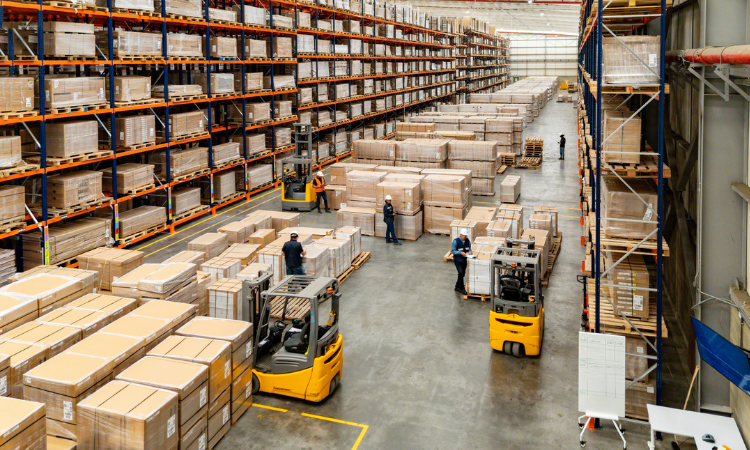
You pulled last week's throughput numbers, saw picking accuracy slip, and made a call. New slotting, maybe, or another push on scan compliance. But those key performance indicators (KPIs) are built on scans and manual logs. Every missed scan and wrong count is baked into the result.
Warehouse efficiency depends on count and movement data you can trust. Formulas and benchmarks only work when the inputs are reliable.
Get capture right, and you'll know which fixes to prioritize first. Layout changes, warehouse management system (WMS) rollouts, and automation spend then start paying off.
Main Takeaways
- Warehouse efficiency compares actual output to standard output, while warehouse productivity only tracks output per labor hour.
- Every KPI depends on the scans, counts, and movement logs behind it, so one wrong count skews the numbers downstream.
- Eight KPIs across space, labor, inventory, and fulfillment give you a baseline, and five of them are the best place to start.
- Storage performance breaks down once utilization passes roughly 85%, so act on space when you see pallets staged in aisles.
- Match your spend to the problem: fix the process first, then data capture, and add capital automation only when volume demands it.
What Is Warehouse Efficiency?
Warehouse efficiency is the ratio of useful output to the inputs used to produce it. Output covers orders shipped, lines picked, and units moved. Inputs cover labor hours, space, gear time, and operating cost. Put simply, it shows how much useful work you get. That's per dollar, per hour, and per square foot.
To calculate it, use Warehouse Efficiency = (Actual Output ÷ Standard Output) × 100. Standard output is the throughput you'd expect from a set amount of labor and space. That assumes normal conditions. Warehouse productivity is narrower, since it only tracks output per labor hour. Efficiency shows how close your real results come to what those same inputs can deliver.
Why Efficiency Gains Have Stalled
Warehouses keep adding technology, yet output per hour has barely moved. Warehousing labor productivity rose just 0.1% in 2024, following steep drops in 2022 and 2023, BLS data shows. That flat line suggests new tools alone aren't closing the gap.
The trouble often starts before any tool touches the data. Every KPI you calculate carries the accuracy of the scans, counts, and movement logs behind it. Extra movement, waiting, rehandling, and bad counts all drain the budget quietly. And because efficiency is a system-wide ratio, one missed scan or wrong count can skew every number downstream.
That's why data capture gets fixed first. The formulas, benchmarks, and fixes that follow cover what to improve, how to measure it, and where to act.
5 Ways to Improve Warehouse Efficiency
Most warehouse improvements fit into one of five categories. Each gets a deeper look later in this guide.
- Optimize layout and space use. Cut travel distance, tighten slotting, and keep occupancy under the 85% mark where congestion jumps.
- Fix inventory accuracy first. Reliable barcode and RFID capture plus steady cycle counts make every later call trustworthy.
- Get more from your WMS and technology. A warehouse management system sorts the work, but it's only as good as its scan and count data.
- Invest in workforce training and standards. Cross-training, clear labor standards, and safety protocols protect throughput and cut injury-driven downtime.
- Measure before you spend. A KPI baseline shows whether a problem needs a process fix, a data fix, or capital spend.
The sequence matters. Layout and data fixes often remove the very problems that automation and capital spending get brought in to solve.
|
Get More From the Equipment You Already Own Forklifts, scanners, and other equipment have their own efficiency math. This guide shows how to calculate asset utilization and raise it. |
How to Measure Warehouse Efficiency: 8 KPIs with Formulas and Benchmarks
Eight KPIs spread across space, labor, inventory, and fulfillment give you a full efficiency baseline. That baseline holds up only when the count and movement data behind each formula is accurate.
The table below pairs each metric with its formula and a benchmark range. Best-in-class targets come from the Warehousing Education and Research Council’s 2026 DC Measures Report, as published in a Yale white paper. Typical figures are common industry rules of thumb.
|
KPI |
Formula |
Benchmark Range |
|
Order Picking Accuracy |
(Orders picked correctly ÷ Total orders picked) × 100 |
97% typical; 99.7% or higher best in class |
|
Order Accuracy Rate |
(Error-free orders shipped ÷ Total orders shipped) × 100 |
98% or higher is a common target |
|
Dock-to-Stock Time |
Total hours from receiving to put-away ÷ Number of receipts |
4 to 8 hours typical; under 3.1 hours best in class |
|
On-Time Shipment Rate |
(Orders shipped on time ÷ Total orders shipped) × 100 |
95% typical; 99.5% or higher best in class |
|
Inventory Turnover |
Cost of goods sold ÷ Average inventory value |
Varies by industry; higher means leaner stock |
|
Average Processing Time |
Total processing time ÷ Number of orders processed |
Track the trend; lower means faster fulfillment |
|
Space Utilization |
(Used storage capacity ÷ Total available capacity) × 100 |
80% to 85% optimal; above 85% raises congestion risk |
|
Labor Productivity (warehouse productivity) |
Units processed ÷ Labor hours worked |
Track the trend against your own baseline |
How to Read These Benchmarks
Use these ranges to find your position on the map. A site running 97% picking accuracy isn't failing. Still, the distance to best-in-class shows up as real cost in returns, credits, and rework. Track only five? Start with these:
- Order picking accuracy
- Dock-to-stock time
- On-time shipment rate
- Inventory turnover
- Space utilization
Every formula here starts on the floor. Orders picked, hours logged, and units counted all come from a scan, a log, or a count. When those inputs are wrong, the KPI is wrong too. That makes tracking accuracy the foundation.
Finance is watching these numbers closely. U.S. business logistics costs fell to $2.4 trillion in 2025, or 7.8% of GDP, according to CSCMP's 2026 State of Logistics Report, presented by Penske Logistics. That's down from $2.6 trillion and 8.7% in 2024. Even after the drop, spending at that scale keeps CFOs focused on throughput and accuracy.
Layout, Space, and the 85% Occupancy Rule
Layout decides how far people travel, how fast they pick, where congestion builds, and how safe the floor stays. The most common mistake is designing racks before you've mapped how work actually flows.
The Rack-First Design Mistake
Here's how it usually plays out. A team buys racking to max out cubic capacity. Then receiving, staging, picking, and shipping get squeezed into whatever space is left. You end up with long travel paths, crowded aisles, weak staging areas, and forklifts crossing paths with pedestrians.
Flip the order. First, map your real process flow from receiving to put-away, storage, pick, pack, and ship. Next, define a zone for each stage, with buffer space between high-traffic areas. Only then should you choose storage types and set up racking to fit those zones.
The safety cost is real. Warehousing logged 4.8 total recordable injury and illness cases per 100 full-time workers in 2024, according to BLS data. That's about double the private-industry average of 2.3, per the BLS. Congested aisles where forklifts and pedestrians share space only add to that risk.
Slotting, Travel, and Flow Tips
Once your zones are set, these habits keep product moving:
- Put your fastest-moving stock keeping units (SKUs) closest to pack and ship stations. Revisit that slotting each quarter as velocity shifts with the seasons.
- Run ABC slotting. A items go in the golden zone at waist to shoulder height, B items sit nearby, and C items take harder-to-reach spots.
- Match your picking method to your order profile. Single-order picking suits large orders, batch picking suits many small ones, and zone picking suits big facilities. Batch picking is gaining ground: 48% of operations used it in a 2025 Modern Materials Handling survey, up from 44% the year before.
- Keep aisles wide enough for two-way traffic where forklifts and pickers share space. Narrow-aisle racking saves cube but creates chokepoints when traffic isn't mapped first.
- Give inbound and outbound their own staging lanes. Shared staging breeds rehandling and wait time.
- Give returns their own lane and process them daily, so returned stock doesn't sit unrecorded.
- Set pack and quality control (QC) stations between pick zones and shipping docks, away from the back wall.
The 85% Occupancy Rule
The 85% occupancy rule says storage performance breaks down once utilization passes roughly 85% of capacity. Above that line, congestion, rehandling, and pick-path delays climb faster than volume does. That last 15% of space is a working buffer that keeps product flowing.
Plenty of sites hit that edge at peak. In a 2024 Modern Materials Handling survey, 21% of operations said they run 85% to 94% full during peak season.
Watch for these signs that you've crossed the threshold:
- Pallets staged in aisles
- A put-away backlog that stretches past one shift
- Pickers waiting on replenishment
- Rising damage and shrinkage
When you see them, act on space before it gets worse:
- Open a cross-dock window so fast-moving inbound skips storage entirely.
- Move slow-moving or seasonal stock to offsite overflow.
- Re-slot to reclaim dead cube.
- Check pallet stacking heights against rack capacity.
These fixes cut travel, congestion, and injury risk without a dime of automation spend. They only stick, though, when accurate throughput and movement data can prove the change worked.
|
Keep Pallet Movement Visible Across Your Whole Facility Misplaced pallets and manual location updates create the same count errors that skew your KPIs. See how RFID-based pallet tracking feeds clean data into your WMS. |
Workforce Standards and Training
Layout and data fixes only pay off when your team works to a shared standard. Your people touch every order, so how they're trained shows up in every KPI.
Start with written labor standards. Define the expected pace for each task, like lines picked per hour or pallets put away per shift, based on your own baseline. Without a standard, you can't tell a slow shift from a hard one.
- Cross-train across zones. Pickers who can also receive or pack let you shift labor to wherever the backlog sits.
- Train on scan discipline, not just speed. A fast pick that skips a scan creates a count error someone pays for later.
- Tie incentives to accuracy and safety, not volume alone. Rewarding raw speed encourages skipped scans and shortcuts.
- Hold short daily huddles. Review yesterday's numbers, flag blockers, and assign zones before the shift starts.
Strong standards also make your next decision easier. When performance stays flat after training, you know the problem sits in layout, data, or capacity, not effort.
Inventory Tracking, WMS Reality, and When Automation Pays Off
A WMS can sort work and report metrics, yet it can't make bad source data trustworthy. Accurate barcode and RFID capture is what lets every system, KPI, and automation spend deliver.
Tracking Accuracy vs. Performance Measurement
Tracking inventory means capturing what you have, where it is, and when it moved. That happens through scans, RFID reads, and cycle counts. Measuring performance turns that data into KPIs like order accuracy, dock-to-stock time, and inventory turnover. Tracking feeds measurement. So even small count errors leave your KPIs describing a floor that doesn't exist.
The fix is achievable. With RFID, item-level inventory accuracy can climb above 95%, GS1 US reports. Label every location and asset. Then cycle count A items most often and B and C items on a slower rotation. Capture each movement with a scan instead of a manual log, and fix gaps the same day.
What a WMS Fixes, and What It Doesn't
Most warehouses already run a WMS, so the system alone won't set you apart. In a 2025 Modern Materials Handling survey, 87% of operations used some type of WMS, down from 93% the year before. Its early wins usually come in task sequencing, wave planning, directed put-away, and pick-path routing.
The gaps show up at the source. Pickers skip scans, location labels go missing or get damaged, and hand-keyed receiving counts go in wrong. The WMS copies each error and spreads it through every task that follows.
That's why teams keep struggling after rollout when scan use and count habits go unenforced. Barcode scanners and RFID readers close the gap. They feed clean data into the system that assigns tasks and reports KPIs. Our REST API sends scan and RFID data straight into your WMS and enterprise resource planning (ERP) system, with no manual re-entry.
When Automation Makes Sense: A 3-Tier Framework
Match the size of your spend to the type of problem you're solving:
- Tier 1: Process fix (low or no cost). If the problem is travel distance, slotting, staging layout, or unclear standard operating procedures (SOPs), fix the process before you buy anything.
- Signs: big swings between shifts and inconsistent pick paths.
- Signs: no standard work on the floor.
- Tier 2: Data and tracking fix (moderate cost). If counts are bad, KPIs feel shaky, or audits fail, invest in barcode and RFID capture plus cycle count discipline.
- Signs: inventory adjustments every period and order accuracy below the typical benchmark range.
- Signs: KPIs and WMS data that don't match what you see on the floor.
- Tier 3: Capital automation (high cost). When demand outruns trained people, good data, and a tuned layout, conveyors, sortation, automated storage and retrieval systems (AS/RS), or goods-to-person systems earn their return on investment (ROI).
- Signs: volume stays above capacity even after Tier 1 and Tier 2 fixes.
Be careful with that last tier. Automation can push complexity back onto operators when the data and processes underneath aren't solid. A system running on bad location data or wrong counts just makes faster, costlier mistakes.
Counting technology is shifting too. Gartner predicts that by 2027, 50% of companies with warehouse operations will use AI-enabled vision systems to replace scanning-based cycle counting. As that matures, the line between Tier 2 and Tier 3 gets blurrier.
So start with tracking accuracy and confirm it through your KPIs. Then put capital automation only where volume truly demands it.
Put Accurate Warehouse Efficiency Data to Work
You can now read a KPI and trust what's behind it. You also know which fixes deserve budget first: process, data capture, or automation.
We help warehouse teams capture barcode and RFID data accurately enough to act on. Your counts and movement records match the floor, so audits stop turning up surprises. Every layout, WMS, and automation call then starts from numbers you can defend.
See how our inventory tracking software gives every efficiency call a reliable starting point.
|
Stop Cycle Counts From Turning Up Surprises When your A-item counts are off, every downstream KPI is off too. See how RedBeam captures barcode and RFID data accurately enough to defend to your CFO. |
FAQs About Warehouse Efficiency
How do I know if my KPI numbers are wrong because of bad scan or count data?
Run a blind cycle count on a sample of A items and compare it to system on-hand. A variance above a few percent means your KPIs describe a floor that doesn't exist. Other red flags include frequent inventory adjustments, order accuracy that clashes with customer complaints, and KPIs your supervisors don't recognize. When you find a gap, trace its cause the same day. Look for skipped scans, missing location labels, or manual receiving entries.
How do I build a business case for a warehouse efficiency investment?
Turn inefficiency into dollars across four costs: wasted labor hours, error and return costs, inventory carrying costs, and delayed throughput. Compare that total to the cost of the fix. Baseline it with your own order accuracy, dock-to-stock time, and labor productivity numbers. Use your own numbers rather than industry averages, since finance will trust your data over a general estimate.
How do I tell whether my problem needs a process fix, a data fix, or automation?
Start with the symptom. Shift-to-shift swings and long travel paths point to a process fix. Untrustworthy counts and KPIs point to a data capture fix. Volume that stays above capacity after both fixes points to automation. Check shift variability, inventory adjustment counts, and remaining capacity gaps. Symptoms often overlap, so fix in order: process, then data, then capital spend.
What if my WMS is already live but my inventory records still don't match the floor?
Audit scan use first. A WMS copies whatever its source data holds. Skipped scans, damaged location labels, and hand-keyed counts keep causing mismatches after rollout. Check three leaks in order. Start with receiving entries. Then check put-away and pick scans. Last, check the condition of location labels. Fix capture at the source and resolve gaps the same day. Changing the WMS won't fix bad inputs.
Do I need a new inventory tracking system to connect scan data to my WMS or ERP?
Usually you don't need a replacement. A data capture layer, like modern RFID software, can sit beside your WMS or ERP. It passes scan and RFID data through a REST API, so you keep the systems you run today. Check that your WMS or ERP accepts API connections. Check what barcode or RFID hardware you have. Check which records need syncing. A capture layer won't replace WMS task planning or fix missing standard work.